Bentley announces record financial results for first half of 2022
- Luxury British marque posts six-monthly operating profits of €398 million
- Unparalleled performance higher than record €389 million achieved during whole of 2021
- Encouraging results put Bentley on target for best-ever year despite continued global economic instability
- Revenue per car climbs from €186,000 in 2021 to €213,000 – return on sales reaches 23.3 per cent
- Global sales hit 7,398 high - up 33 per cent in Europe and 44 per cent in UK year-to-date
- Figures follow €3 billion investment commitment at Crewe factory and in electrification of products
- Results support Bentley’s industry-leading Beyond100 strategy
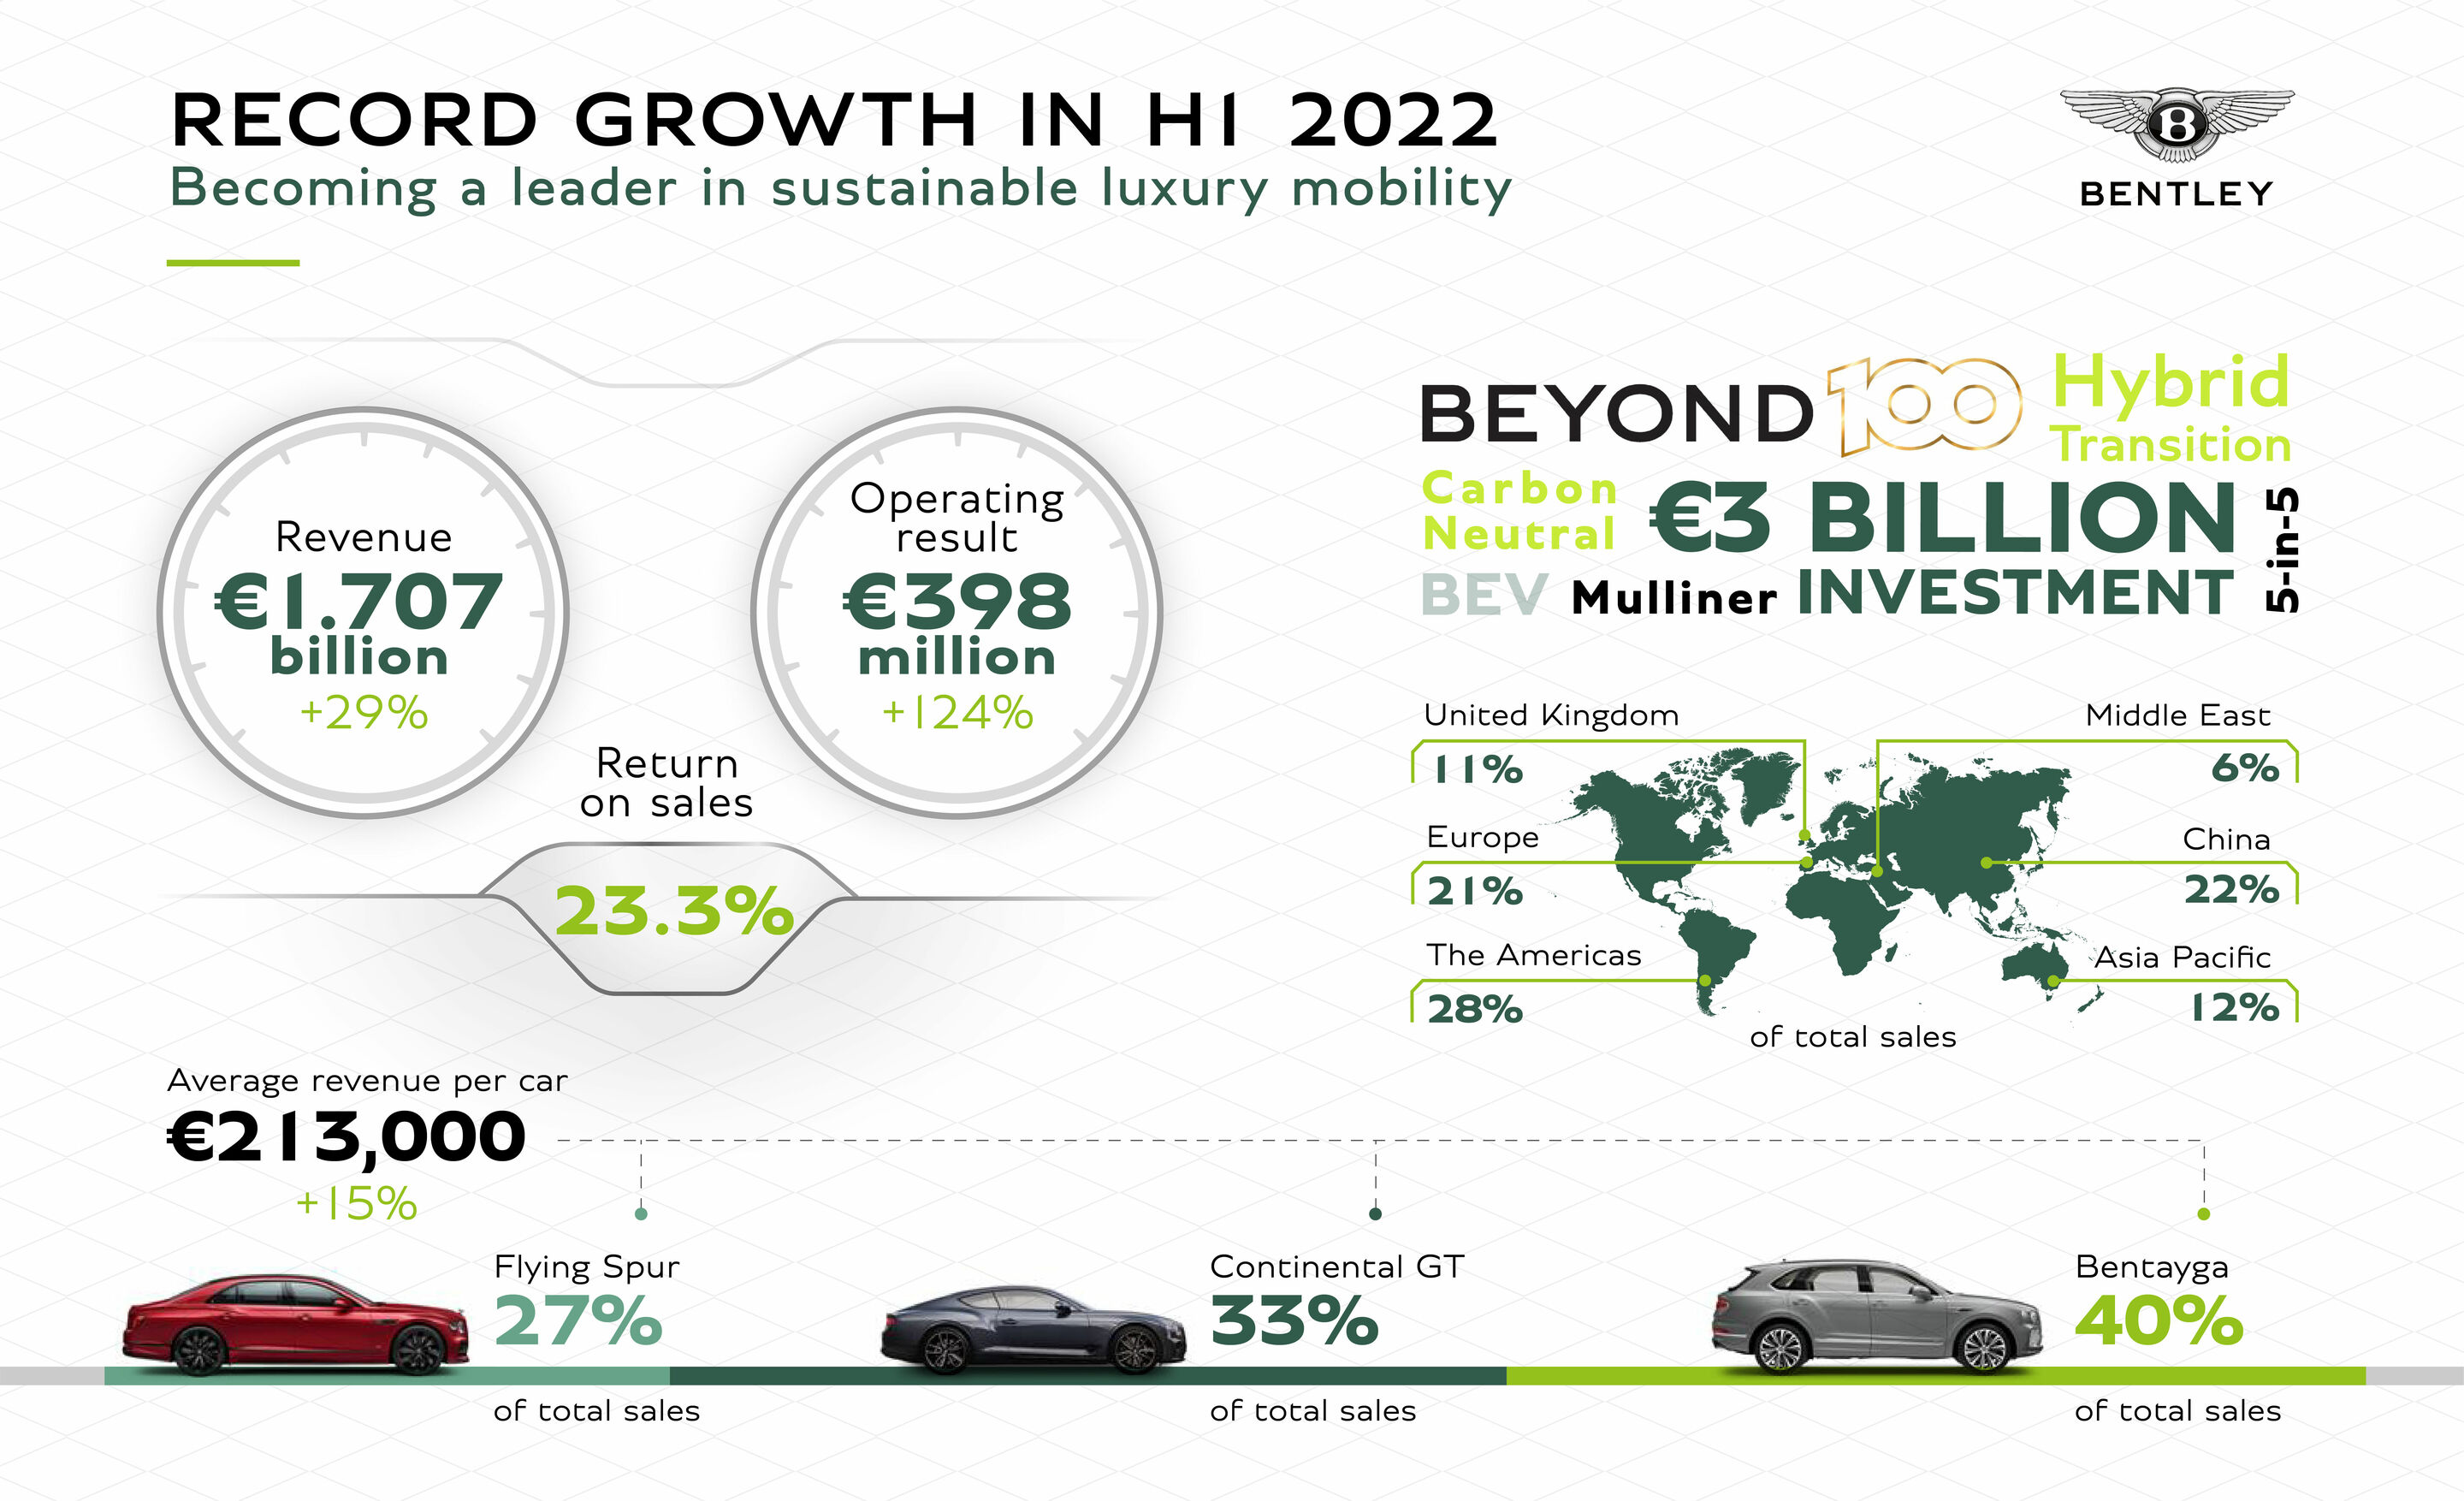
Bentley Motors today announced encouraging financial results for the first six months of 2022, despite continued global economic uncertainty. While the outlook for the second half of the year remains challenging, the luxury British marque posted operating profits of €398 million, up 124 per cent on the same period last year. The half-yearly figures compare favourably to €389 million for the whole of 2021, the company’s previous record year.
Turnover increased from €1.324 billion during the first half of 2021 to €1.707 billion, while revenue per car climbed from €186,000, to €213,000, largely due to increased levels of personalisation. No luxury brand now sells more cars over €200,000 or €250,000 than Bentley. Return on sales also reached a record 23.3 per cent during the first six months of 2022, up from 13.4 per cent the previous year.
The best-selling Bentayga luxury SUV claimed 40 per cent of total sales, with the latest Flying Spur sedan accounting for 27 per cent, and the Continental GT Grand Tourer recording 33 per cent.
Bentley sales were up 33 per cent in Europe and 44 per cent in the United Kingdom year-to-date, helped by the introduction of the Continental GT Speed. The Americas remained the company’s strongest market, while China was impacted by extended Covid-19 lockdowns. Globally, year-to-date sales increased 3 per cent to 7,398 extraordinary cars, up from 7,199 during the same period in 2021.
The latest figures support Bentley’s forward-looking Beyond100 strategy, as the British brand reinvents its entire product range to embrace an electrified future, achieving carbon neutrality by 2030. This includes a €3 billion ten-year investment programme in future products and at the Pyms Lane factory in Crewe, where all Bentley models are built.
Adrian Hallmark, Chairman and CEO of Bentley Motors, commented: “Despite the continued global economic instability, it is promising to see Bentley is showing financial consistency as we reinvent the company in line with our Beyond100 strategy and form a basis to withstand further external shocks. In particular, a significant increase in demand and capitalisation of our Mulliner personalisation programme has driven record return on sales, and continued global interest in the freshest model line in the luxury sector has resulted in record high revenues.
“I would like to thank our hard-working colleagues for their continued efforts, as Bentley continues its ground-breaking transformation towards an electrified future, financial independence and to be the leader in sustainable luxury mobility.”
Jan-Henrik Lafrentz, Member of the Board for Finance & IT, at Bentley Motors, added: “Bentley has continued to focus its efforts on building sustainable, long-term profitability. These results reflect a strong base pricing position, increased revenue through optionality and favourable foreign exchange rates. In parallel, we continue to maintain our lower cost base which is leading to a restructured business model that is delivering strong returns on our investment and sales.”
Half-year financial figures
| Financial result | 2022 HY | 2021 HY |
| Revenue | €1.707 billion (+29%) | €1.324 billion |
| Operating Result | €398 million (+124%) | €178 million |
| Return on Sales | 23.3 per cent | 13.4 per cent |
Half-year sales figures
| Market | 2022 HY | 2021 HY | 2022 HY (% of total sales) |
| Americas | 2,068 (+1%) | 2049 | 28% |
| Chinese mainland, Hong Kong and Macau | 1,621 (-25%) | 2,155 | 22% |
| Europe | 1,524 (+33%) | 1,142 | 21% |
| Asia Pacific | 916 (+18%) | 778 | 12% |
| United Kingdom | 795 (+44%) | 554 | 11% |
| Middle East | 474 (-9%) | 521 | 6% |
| Total | 7,398 (+3%) | 7,199 | 100% |